Comparing Costs for Space Launch Vehicles
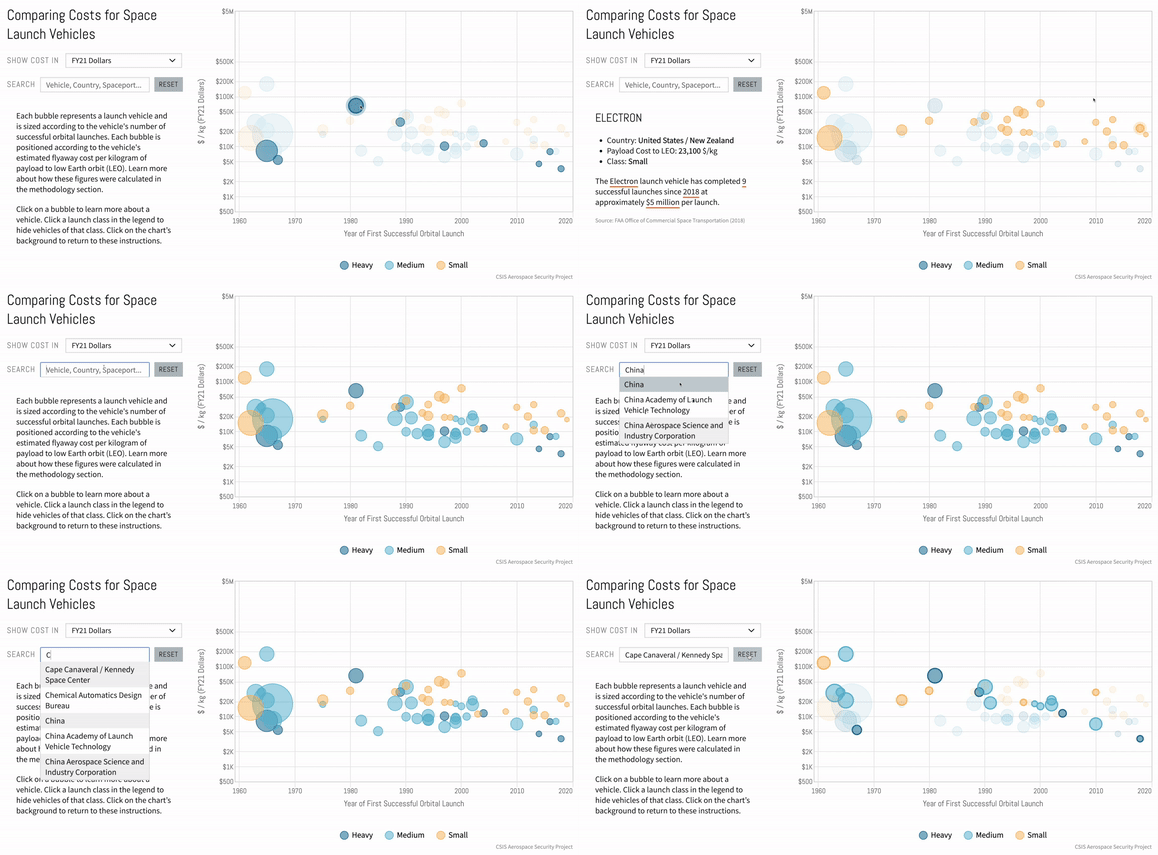
Each bubble represents a launch vehicle and is sized according to the vehicle's number of successful orbital launches. Each bubble is positioned according to the vehicle's estimated flyaway cost per kilogram of payload to low Earth orbit (LEO). Learn more about how these figures were calculated in the methodology section.
Click on a bubble to learn more about a vehicle. Click a launch class in the legend to hide vehicles of that class. Click on the chart’s background to return to these instructions.
